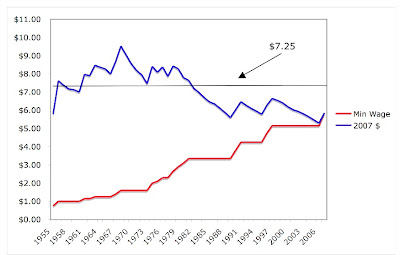
While looking at some data on the US federal minimum wage, I came across an interesting trend. One of the themes of Going Broke is that something happened in America beginning in the 1970s. The symptoms were dramatic increases in rates of bankruptcy and personal indebtedness that continued right into the 21st Century, but the causes of these signs of soaring of financial misery are far from obvious. I make a case for the combined effects of several modern pressures, and one of these is economic insecurity produced by declining real wages for many workers. Now take a look at the graph below, which I constructed a few days ago.
The red line of the graph shows the actual or “nominal” minimum wage for each year since 1955, and the blue line shows that wage, adjusted for inflation, in 2007 dollars. So, for example, in 1979 the minimum wage was $2.90/hr but it had the equivalent buying power of $8.28/hr today. The overall arc of the blue line shows that, here, too, something happened in the 1970s. From 1955 through 1968, the minimum wage rose sharply, peaking out at $9.53/hr (adjusted for inflation) in 1968, but since the late 70s, the minimum wage has been on a long and jagged slide.
Last year, in the wake of Hurricane Katrina and the Democratic congressional victory of 2006, Congress and the President agreed to a plan to increase the federal minimum wage. Under the new law, the wage will increase in each of three years, topping out at $7.25/hr in the summer of 2009. The graph shows that, when the minimum wage hits this point, it will bring us back to where we were in 1982, when the nominal minimum wage was $3.35/hr. Of course, this really overestimates the increase, because by the time the summer of 2009 rolls around, inflation will undoubtedly have increased, pushing the black horizontal farther down relative to the blue line.
Most states have set their own minimum wages at rates higher than the federal rate, but as this map from the US Department of Labor shows, there are 18 states (blue, red, and yellow below) for which the federal minimum wage applies, including Louisiana and Mississippi, the states most severely affected by Hurricane Katrina. Economists argue about whether increasing the minimum wage has the negative effect of increasing unemployment. But we know that income disparity has increased over the last three decades, and it seems likely that this trend in the federal minimum wage has been a contributing factor.
Monday, February 18, 2008
Something Happened in the 1970s: The Minimum Wage in Perspective
Subscribe to:
Post Comments (Atom)

No comments:
Post a Comment